Observability Console
The central view for real-time monitoring and sequence inspection.
Observability Console
The Observability Console is the central command center for real-time monitoring and sequence debugging. Because Elemm executes multi-step sequences on the gateway level (abstracting them away from the LLM), this dashboard is vital for developers to inspect exactly what the agent is doing under the hood.
Key Features
- Live Activity Stream: Chronological view of all tool calls with durations, token costs, and success/error status.
- Sequence Drill-Down: Visual timeline representation of multi-step sequence executions to pinpoint bottlenecks or failures.
- Sequence Piping Map: Graphical trace showing how variables (e.g.,
$user_id) flow from the output of one step into the input of the next. - Full Historical Ledger: Searchable archive of all past interactions, allowing post-mortem inspection of raw JSON payloads and errors.
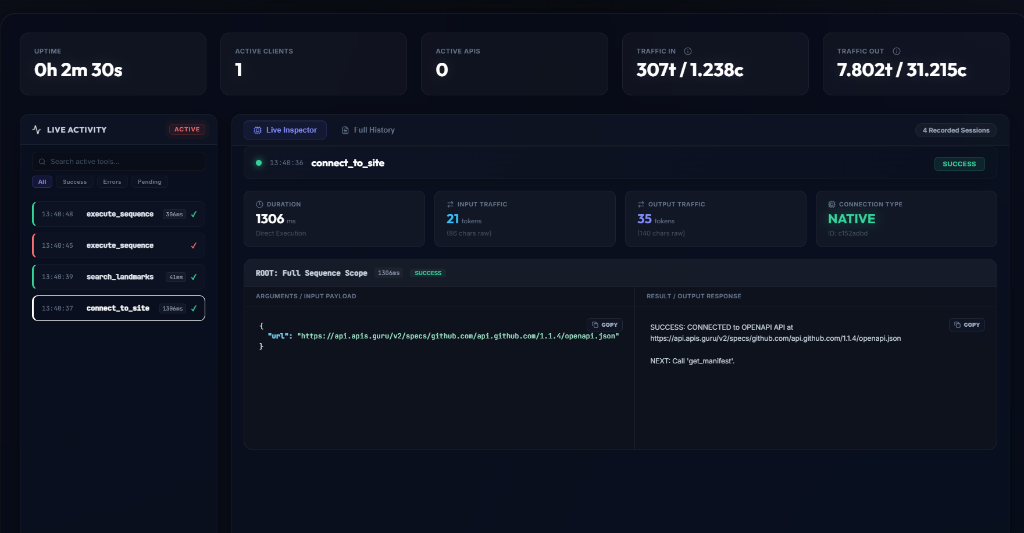
1. The Global Stat Bar
At the top of the dashboard, you'll find critical high-level metrics:
- Uptime & Active Clients: See how long the gateway has been running and how many agents are currently connected.
- Traffic Ledger: Displays exactly how many tokens (and raw bytes) are flowing in and out of the gateway, giving you real-time visibility into the cost of your AI operations.
2. Live Activity Stream (Left Sidebar)
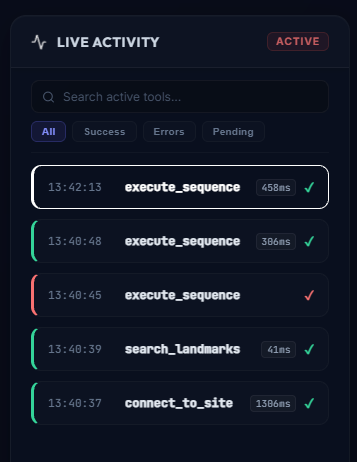
The left panel provides a chronological, streaming log of all tool executions as they happen.
- Color Coding: Green for success, Red for errors, ensuring you can spot issues at a glance.
- Timing: Instantly see how long a sequence or tool call took (e.g.,
458ms).
3. Sequence Execution Pipeline
The core power of the Observability console lies in its ability to break down the execute_sequence tool. Since a sequence executes multiple tools in a single LLM turn, the console unpacks this "black box" into a visual chronology.
Step-by-Step Drill Down
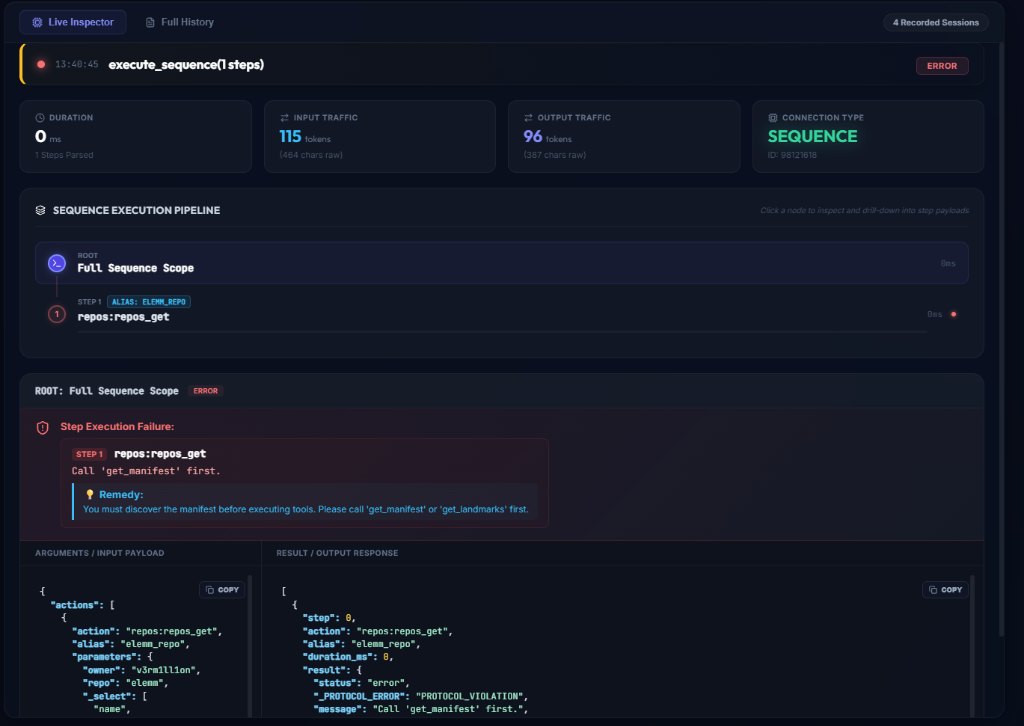
- Each step is displayed as a node on a timeline, showing its individual execution time and status.
- You can click on any node (e.g.,
repos:repos_get) to view its exact Input Payload and Output Response. - Error Diagnostics: If a step fails (as seen above with a
PROTOCOL_VIOLATION), the console highlights the exact step and provides the raw error message (e.g., "Call 'get_manifest' first.") to help you debug agent behavior instantly.
Sequence Data Piping Map
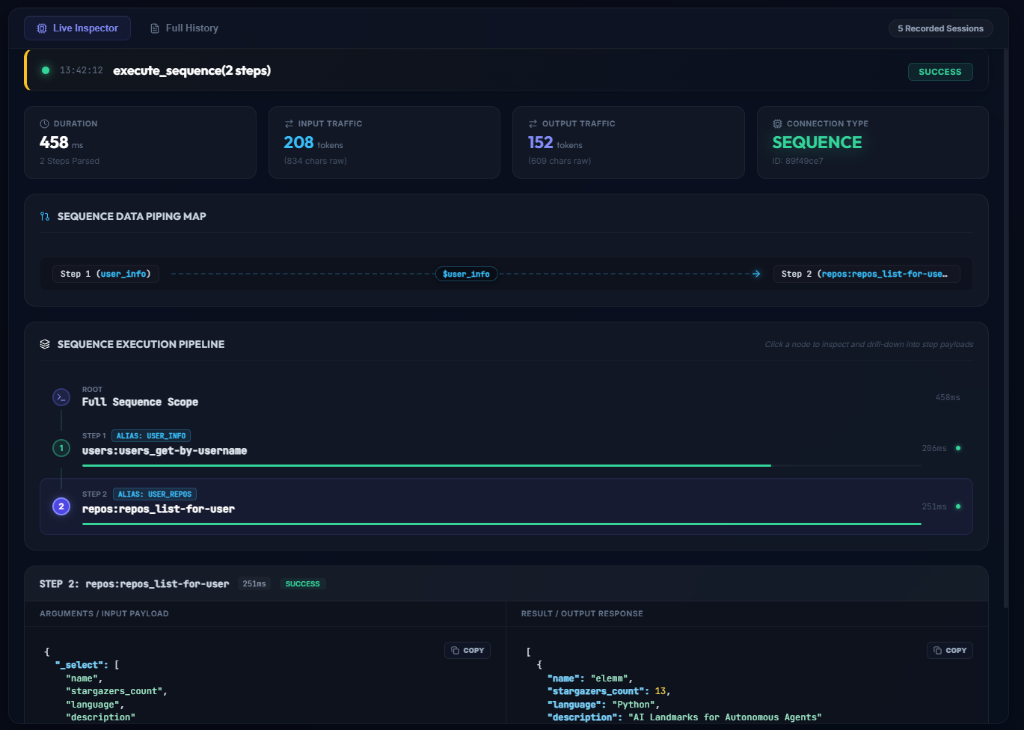
Elemm's Sequencer allows the LLM to pipe the output of one step into the input of the next step (e.g., extracting an ID from step 1 and using it in step 2).
The Sequence Data Piping Map visualizes these cross-step variable resolutions graphically. It shows exactly which variable (e.g., $user_info) was piped from which source step and injected into which target step. This makes debugging complex, multi-step data extractions incredibly intuitive!
4. Full History View
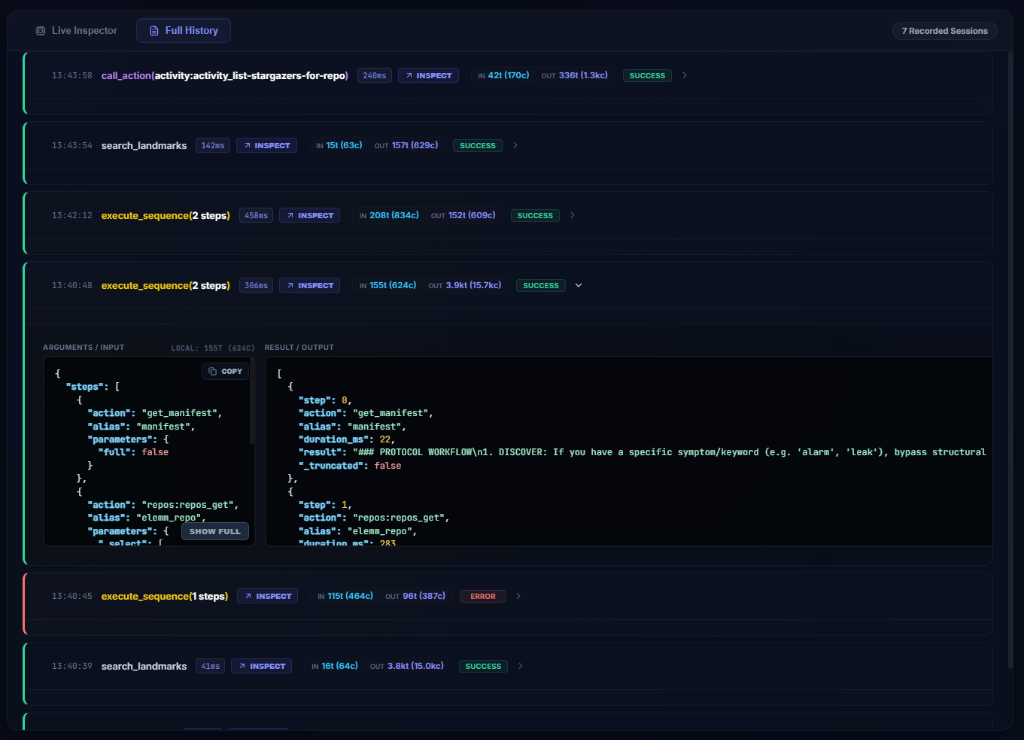
While the Live Inspector focuses on the currently executing sequence, the Full History tab provides a detailed, searchable ledger of all past interactions.
- You can instantly see the exact input and output payloads (and their respective token sizes, such as
155tin,3.9ktout) for every action ever taken by any connected agent. - Expanding a row reveals the raw JSON payload alongside timing metrics, making post-mortem analysis of failed sequences or hallucinated payloads completely transparent.